Monthly Rental Stats
OC is responsible for this task. If the 5th falls on one of the OC's off days, then LC1 picks up this task.

- Sheets: Each sheet corresponds to a specific month and year (e.g., "3-2025" for March 2025, "12-2024" for December 2024, etc.).
- Rows: The rows include metrics such as Total Leases, New Listings, Average Sold Price, Median Sold price, and Average Days on Market. There are also columns for percentage changes over time.
- Time Periods: This sheet shows a time period of 12 months.
- Total Leases: The number of leases signed for SFRs and Duplexes.
- New Listings: The number of new properties listed for rent.
- Average Sold Price: The average price at which properties are leased.
- Median Sold Price: The median price at which properties are leased.
- Average Days on Market: The average number of days a property stays on the market before being leased.
- Percentage Change: Calculated as the percentage change in each metric from one year to the next.

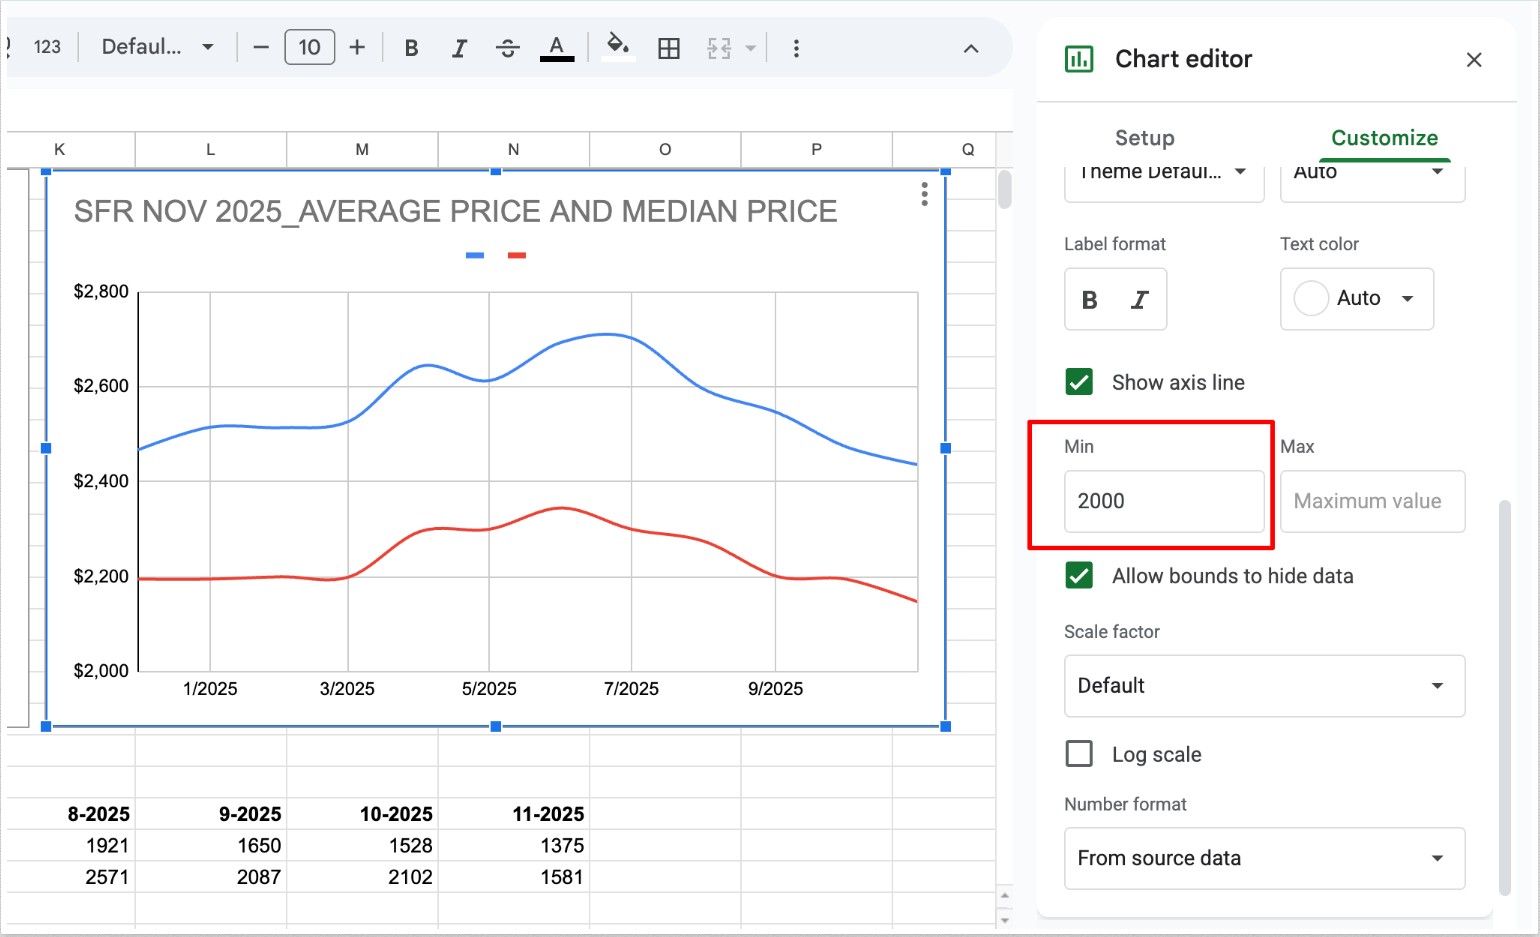
- The above charts show the relationship between SFR average and median rental rates of February 2025
-
The second chart shows the relationship between the SFR units leased and the new listings for February 2025.
Note: the image with average and median rates should have a $2k minimum on the associated axis. The image with unit leased and new listing rates should have a $1k minimum on the associated axis.
-

How to Generate the Stats
Note: When generating data for Avg Sold Price and Median Sold Price, make sure to set/check the MLS section to “Unlock MLS” to generate the most accurate data.
Please see the attached Loom for reference:
https://www.loom.com/share/833d7ffe20fd4b5da3bd006b2f95440b
Here is the sheet to use: https://docs.google.com/spreadsheets/d/1rxXz1tQoj3k-jkPychWyRedbHIpeHfGJssZOV-ZuLXI/edit?gid=1886743510#gid=1886743510
Creating Graphics out of Data:
Once the data sheet has been updated, enter the data into the Rental Statistics Template
Template Link: Monthly Rental Statistics
Slide 1: 12-Month Austin Metro SFR Average & Median Rental Rates

Update Headline: Change the month and year in the title.
Update Chart Data: Double-click the line graph. A data table will appear.
Update the following columns: Month, Average Price, Median Price
Update Value Labels: Once the graph updates, update all pop-up value labels to match the new numbers.
Update X-Axis: Ensure month and year labels match the updated data.
Update Source Date: Edit the source date at the bottom of the chart.
Slide 2: 12-Month Austin Metro SFR Units Leased & New Listings

Update Headline: Change the month and year in the title.
Update Chart Data: Double-click the line graph. A data table will appear.
Update the following columns: Month, Units Leased, New Listings
Update Value Labels: Once the graph updates, update all pop-up value labels to match the new numbers.
Update X-Axis: Ensure month and year labels match the updated data.
Update Source Date: Edit the source date at the bottom of the chart.
Slide 3: Statistics Table

Update Month/Year Header: Change the title to the correct reporting month.
Update All Data Fields: Copy exact values from the Excel data sheet. Do NOT round or estimate numbers.
Update Data Source: Update the source month/year at the bottom.
Slide 4: Austin Metro Duplexes Stats

Update the Following Metrics:
Average Leased Price
Median Leased Price
Average Days to Lease
Total Leases
% Change vs Previous Year
✔ Ensure values match the data sheet exactly.
Slide 5: Austin Metro SFR Stats

Update the Following Metrics:
Average Leased Price
Median Leased Price
Average Days to Lease
Total Leases
% Change vs Previous Year (if applicable)
✔ Ensure values match the data sheet exactly.
Export the File from Canva
Download the photos in two versions: Newsletter and High Resolution.
- Go to the upper right corner of the screen and click Share.
- Click Download.
- Create two separate copies using the settings below.
Newsletters Version (90-130 kb)
Set the following download settings:
- File Type: JPG
- Size: 1x
- Quality: 40–60
Click Download and save the file in the Newsletter folder.
High Resolution Version (300-480kb)
Set the following download settings:
- File Type: JPG
- Size: 1x
- Quality: 70–80
Click Download and save the file in the High Resolution folder.
After downloading, send the files via email to Adrienne.